Product Management
Experience
I Improve The Odds of Product Success
Developing and launching products that satisfy customer need is fundamental to business survival. Developing and launching products that become a marketplace success is a skill that many businesses never fully master. What seems obvious to a product management team can fail miserably in the marketplace. This generally happens because the team hasn’t paid enough attention to the incredible amount of detail required to create and launch marketplace success products. Without a structured approach to ensure that every detail is managed successfully, the odds of creating a marketplace success product are 50/50, at best. I significantly improve these odds through my experience using a proven, structured, product development methodology. In the following paragraphs I describe a few of the products for which I have been responsible that became marketplace successes.
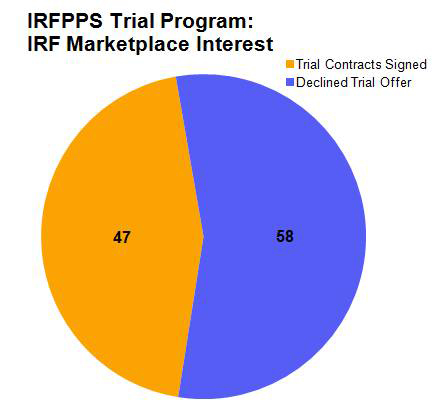 IRFPPS Trial Marketplace Interest
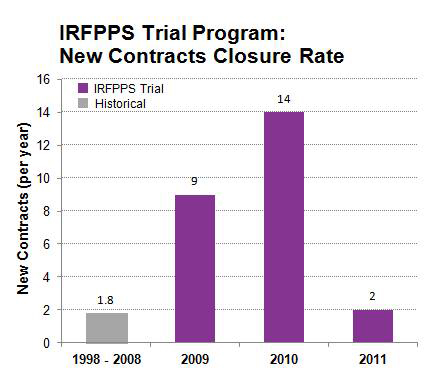 IRFPPS Trial New Contracts Closure Rate
 IRFPPS Trial Total Contract Value
MediServe – IRFPPS Trial Program
In May 2008 MediServe Information Systems, Inc. (MediServe) made the decision to allow prospective clients to “try-before-they-buy” its MediLinks IRFPPS software product. This decision was made to spur sales growth for this product since it had just undergone a major renovation and that investment needed to be recouped. I was assigned by the CEO to create and manage the program by which MediServe was to accomplish this mission.
Working with the Marketing, Sales, Product Management, Service Delivery, and Executive departments I coordinated the development of what became known as the “IRFPPS Trial Program.” The basic premise of this program was that MediServe made a bet with prospective clients that if they didn’t see an increase of at least $1,000 in average per-patient Medicare payment due to the use of the MediLinks IRFPPS software that they didn’t owe MediServe anything for the use of the software. If they realized an increase of $1,000 or more they owed MediServe $10,000. We referred to this as “The Bet.”
The reasoning behind the creation of this program was that once prospective clients had proven to themselves that the MediLinks IRFPPS software could produce a gain of at least $1,000 in per-patient Medicare payment (which is revenue for an IRF) that the benefit of using the product long-term would be self-evident and they would purchase the product. Given that Medicare payments to IRFs had been declining year-over-year, MediServe believed that “The Bet” would be taken up by a significant majority of the IRFs who listened to the IRFPPS Trial Program sales pitch.
This was a high-risk endeavor for MediServe. It was going to be expensive and it was risking MediServe’s reputation in the Inpatient Rehabilitation Facility (IRF) segment of the Post-Acute Care Market. If the software didn’t decisively win “The Bet” in the majority of IRFs who conducted an IRFPPS Trial then future sales of the product would be at risk since there are only 1,170 IRFs in the U.S. and they routinely talk among themselves. My primary responsibility was twofold; 1. Ensure that the program was organized as efficiently as possible to reduce its cost, and 2. Ensure that every IRFPPS Trial was executed correctly so that MediServe would be able to unamabiguously prove that any gain in per-patient Medicare payment during a Trial was due to the use of the MediLinks software.
The results of the IRFPPS Trial Program were spectacular. 45% of those contacted about the program signed an IRFPPS Trial Agreement and 94% of these IRFs actually conducted the IRFPPS Trial at their institution. 53% of those IRFs that conducted a Trial contracted with MediServe to continue the use of their MediLinks IRF software for either a 3-year or 5-year term. For the 10-year period prior to the launch of the IRFPPS Trial Program (1998 – 2008) MediServe had sold an average 1.8 MediLinks IRF software contracts per year. From August 2008 through July 2010 the Trial program produced a total of 25 new contracts, an average of 12.5 new contracts per year. This represented a 690% increase in the rate of MediLinks IRF contract closures.
The total amount of new revenue produced from these 25 new contracts totaled $14.9M (Total Contract Value, or TCV). To put that in perspective, at the beginning of the IRFPPS Trial Program in the summer of 2008 MediServe was generating approximately $15M in annual revenue. Of this $14.9M in new TCV, $9.1M (61%) was for the IRFPPS-Only version of the MediLinks IRF product (this version produced revenue gain, but didn’t include complete IRF documentation), $3.7M (25%) was for the full version of the MediLinks product (which includes both revenue gain and complete IRF documentation). $2.1M (14%) of the new TCV was generated by IRFPPS Trial clients who initially signed an IRFPPS-Only contract but later upgraded to the full MediLinks IRF product.
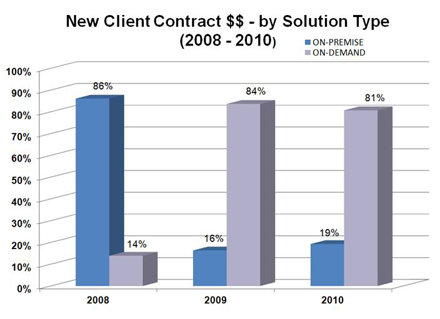
While MediServe undertook the IRFPPS Trial Program to generate new revenue, it also needed the program to produce a significant shift in the way that it delivered its software solutions to clients. Prior to the IRFPPS Trial, the majority of MediServe sales (for all software solutions which include IRF, Respiratory, and Outpatient Therapy) were for On-Premise delivery of MediServe software. Clients purchased a license to use the MediServe software solution and it was installed on servers located on their premises which they maintained and supported. On-Premise contracts produced large revenue spikes and large, infrequent payments that made managing the MediServe business very challenging.
MediServe strongly desired to change its historical On-Premise software delivery model to an On-Demand, or Software as a Service (SaaS) delivery model. This desire was driven by two factors; 1. The need to be able to manage the business more effectively, and 2. To increase business valuation. Just as the IRFPPS Trial Program began, the Great Recession hit in September 2008. Because MediServe was offering its software solutions on a pay-as-you-go monthly subscription basis, its new clients could get subscription funding approval much easier that trying to obtain approval for capital (which was non-existent anywhere at the time). As a result, MediServe radically shifted its service delivery model from On-Premise to On-Demand, largely driven by the IRFPPS Trial Program, during the 2-year period from 2008 – 1010.
By the completion of the IRFPPS Trial Program in July 2010 MediServe had completed the transition of its service delivery model from On-Premise to On-Demand (SaaS). Almost all new clients purchased and used MediServe’s software solutions over the public Internet. Operating the MediServe business became much more predictable. As a result MediServe was purchased on December 11, 2012 by Thoma Bravo, a private equity firm based in San Francisco, for 8 times EDITDA. This outcome was made possible in large part by the results of the IRFPPS Trial Program.
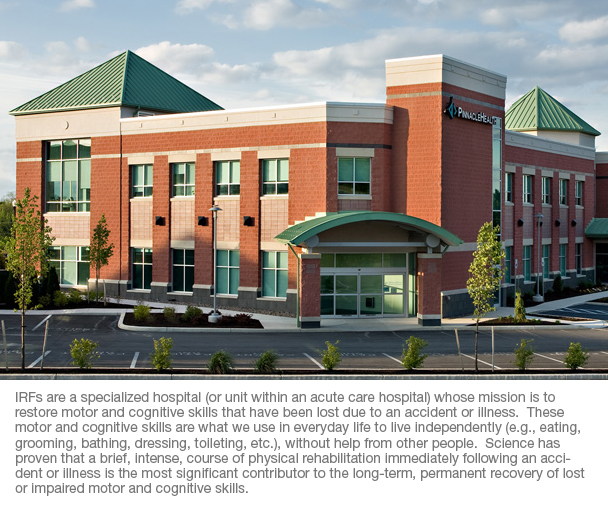
 IRF Hospital (click to learn more)
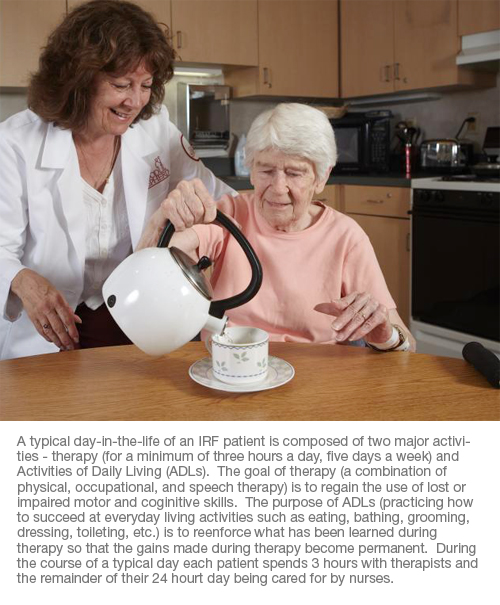
 Practicing ADLs (click to learn more)
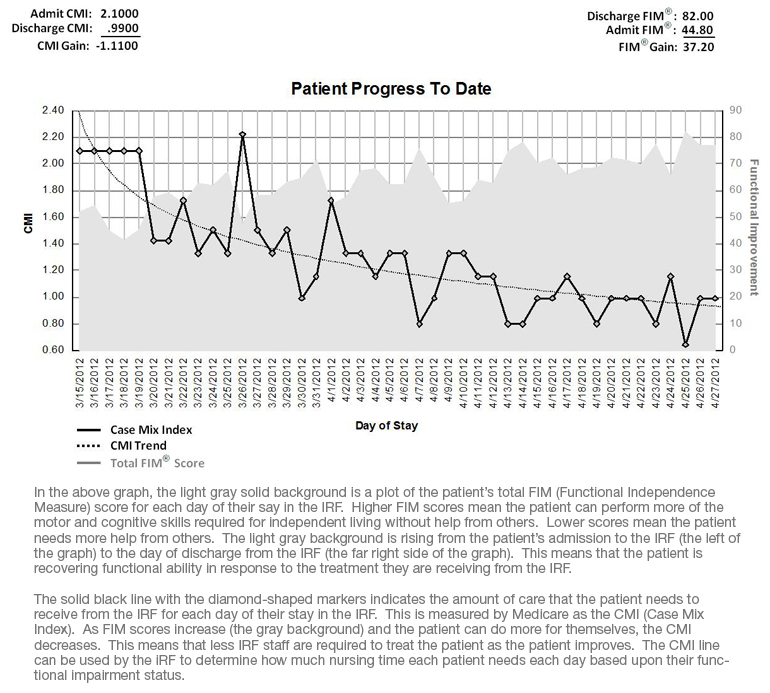
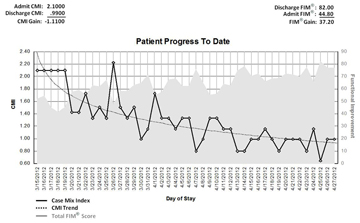 Patient Current Progress Report
(click to learn more)
![]() St. Luke’s Rehabilitation Institute
St. Luke’s Rehabilitation Institute
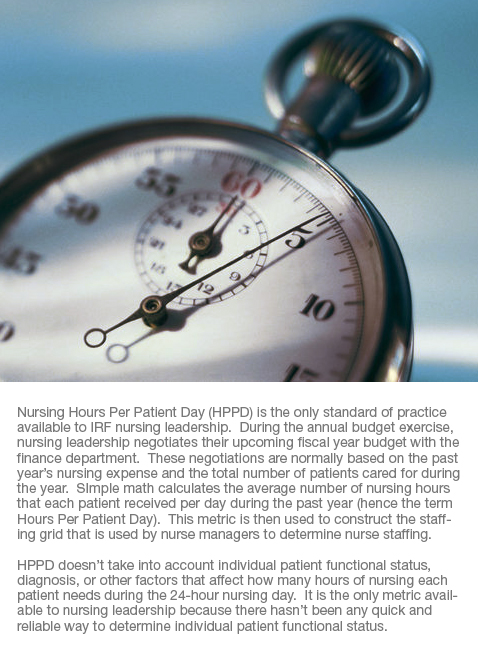
 Nursing Hours Per Patient Day (HPPD)
(click to learn more)
 Staffing Grid HPPD Variance Distribution
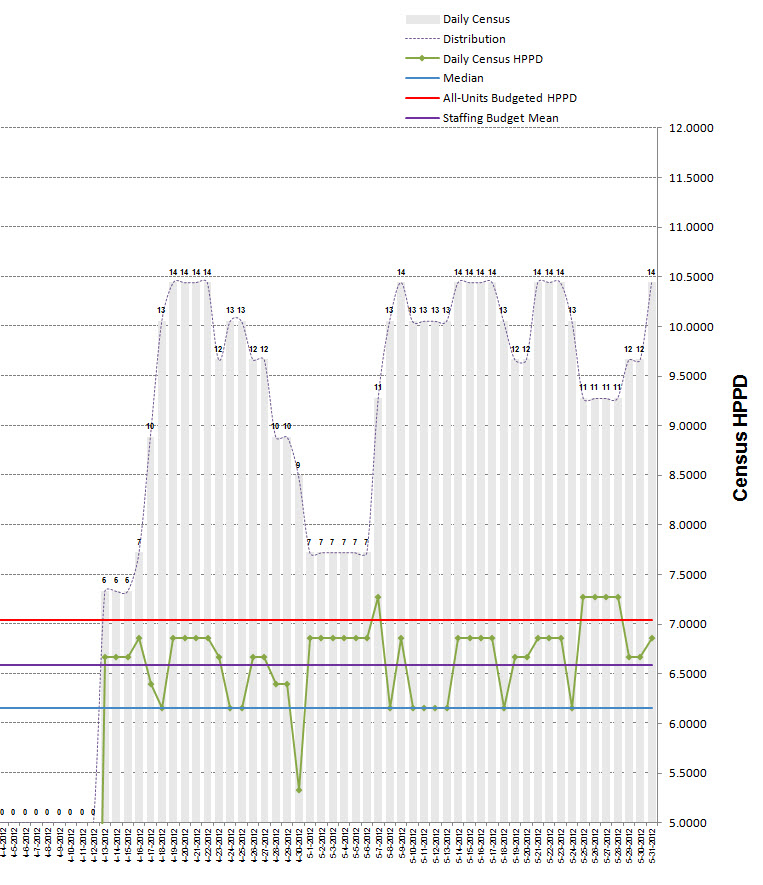
 Census HPPD Variance Distribution
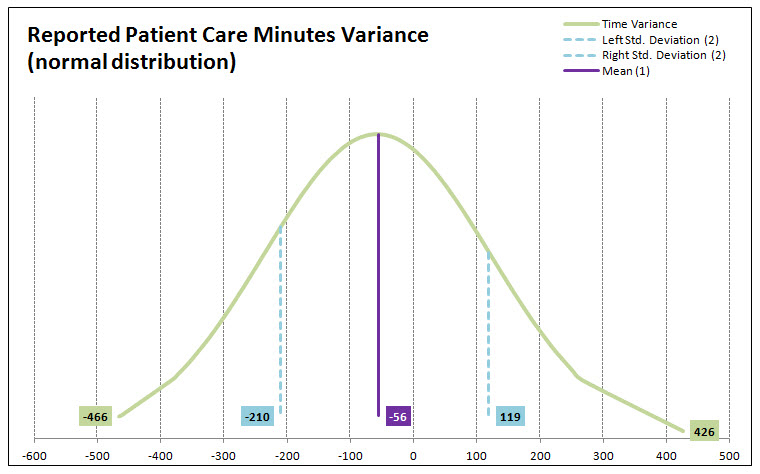
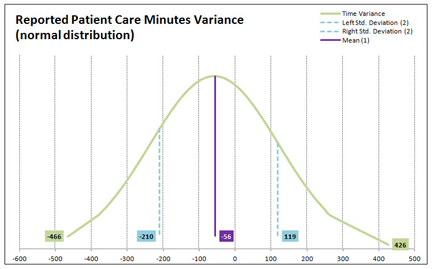 Time Study Reported Time Variance Distribution
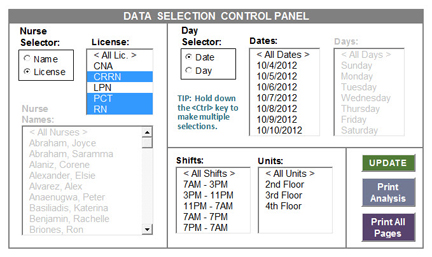 Time Study Data Selection Control Panel
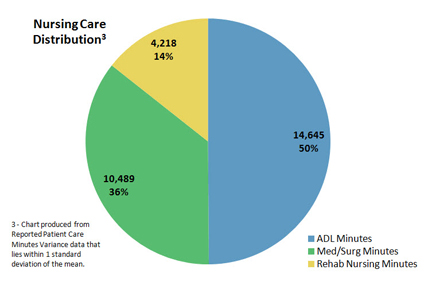 Time Study Nursing Care Distribution
MediServe – Rehab Nurse Staffer (RNS)
I was the Program Manager responsible for developing and launching MediServe’s Rehab Nurse Staffer (RNS) product to the Inpatient Rehabilitation Facility (IRF) segment of the U.S. healthcare Post-Acute Care market. In this role I worked with MediServe’s Engineering, Product Management, Marketing, Sales, and Executive teams to define, prototype, field test, refine, package, and launch the RNS product. I worked very closely with MediServe’s senior IRF strategist (who has 30+ years experience running a variety of U.S. IRFs) to define the needs of the IRF segment regarding their inability to staff their nursing function based upon individual patient nursing need.
Nursing is the largest expense in an IRF, accounting for 18% – 30% of revenue. IRF nurses deliver the same medical/surgical (med/surg) services as nurses that work in an acute care hospital plus additional services that are unique to the IRF care setting. What makes IRF nurses different from acute care hospital nurses is that IRF nurses are responsible for working with patients to continually practice and reinforce what the patient has learned in therapy. This continual practice and reinforcement is known as “rehab nursing.” The only place in the entire U.S. healthcare system where it is practiced is the IRF.
The unique nature of IRF nursing means that determining what type of nurse (i.e., RN, LPN, or CNA) and how many of each type should work each nursing shift is very challenging and has never been automated using software. Whereas acute care hospital nurse staffing is concerned only with the delivery of med/surg nursing services (and is well understood and automated) IRF nursing delivers the same med/surg services plus rehab nursing services. What complicates IRF nurse staffing is understanding how much nursing care each IRF patient needs based upon their current functional impairment status. Until the development of MediServe’s RNS software solution the IRF industry has never been able to quickly and reliably determine each patient’s current functional status and use that information as an input to staffing each IRF nursing shift.
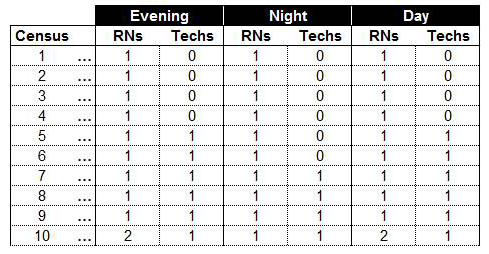
The key benefit that the RNS product delivers to IRFs is that it uses the data they already produce and determines each patient’s individual functional status at the beginning of each day of their stay in the IRF. This is an impossible task to perform without the aid of computers because the volume of data that must be processed for each patient, each day, is large and complex. Because of this fact, IRFs have used what’s known as a “staffing grid” to determine what type and how many nurses should work each shift. Staffing grids don’t tell nurse managers anything about each patient’s functional impairment status. They are produced during the IRF’s annual budgeting exercise. Their purpose is to communicate to nurse managers the maximum number and type of nurses that can be scheduled for a particular nursing shift so that nurse manager do not exceed the nursing personnel budget established for the number of patients (census) they are caring for on each shift.
Staffing grids are ignorant of individual (or group, for that matter) functional impairment status (which is the determinant of nursing need). This means that a census of 20 patients on last Tuesday’s Day nursing shift will be scheduled with the exact same types and numbers of nurses as any other Day nursing shift whose census happens to be 20 patients (nurse managers do have the latitude to make staffing exceptions but normally this happens only for unusual circumstances). This causes three major problems – 1. Patients are not receiving the correct amount of nursing time each day of their stay in the IRF (it’s usually too much but may be too little), 2. The IRF isn’t able to accurately manage nursing cost because it doesn’t know each patient’s current functional impairment from which nursing need is determined, and 3. The correct types and number of nurses needed to treat the individual nursing needs of each patient on every nursing shift will most likely not be scheduled, thereby setting the stage for the occurence of Sentinel Events.
Because IRFs weren’t able to staff their nursing function using patient data, an opportunity existed for MediServe to create a software product to meet this need. I worked with St. Luke’s Rehabilitation Institute, located in Spokane, WA, for over a year as the Field Trial client who provided IRF industry input into the RNS product feature set. Their assistance was extremely valuable and enabled MediServe to launch the RNS product in September 2012. Near the end of the Field Trial it became very clear that the RNS product couldn’t address one critical deficiency associated with using IRF patient data to determine IRF nurse staffing: there were no IRF nursing standards of practice that RNS could use as baseline assumptions to calculate proper nurse staffing.
A nursing “standard of practice” is simply the collection of metrics that are tracked by an IRF to describe how they deliver nursing care to their patients. Since IRF nursing is composed of three types of nursing care (i.e., med/surg care, ADL care, and rehab nursing care) an obvious IRF nursing standard of practice would be “What is the average percentage distribution for med/surg care, ADL care, and rehab nursing care across all patients?” If it existed, RNS would use this particular standard of practice as its baseline assumption from which it would calculate proper nurse staffing for each nursing shift. As it turned out, this particular nursing standard of practice did not exist. This meant that each MediServe RNS client would have to provide their own nursing standard of practice to use as the baseline assumption for their RNS installation. However, the only standard of practice that individual clients had in their possession was the venerable nursing Hours Per Patient Day (HPPD).
HPPD only describes how many total hours of nursing care each patient is supposed to receive every 24-hour nursing day. It doesn’t describe the distribution of each type of care – med/surg, ADL, and rehab nursing. In July 2012 St. Luke’s reported that they believed the assumptions they has used for RNS were incorrect. In trials run on their spinal cord and stroke units RNS was calculating that St. Luke’s needed more nurses than indicated on their staffing grid. Even rank-and-file nurses told nursing leadership that they felt these units were being overstaffed by RNS. St. Luke’s had “guesstimated” the distribution of med/surg, ADL, and rehab nursing care when RNS was first installed and configured because they (like everyone else in the IRF industry) had never tracked care distribution as a nursing standard of practice. It became obvious that some sort of tool had to be created to determine each IRF’s unique nursing care distribution if RNS was going to become a commercial success.
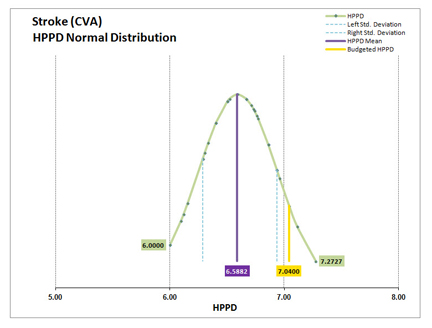
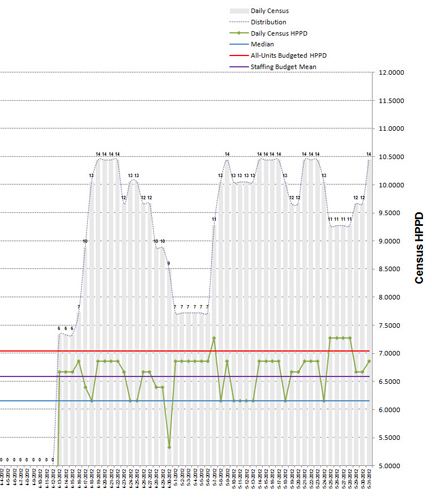
I was tasked with developing a set of tools that could be used to analyze each client’s staffing data and determine from the data the “statistically correct” value of their HPPD. We knew from the St. Luke’s spinal cord and stroke unit tests that the “budgeted HPPD” (the HPPD determined during their annual budget exercise) was producing over-staffing recommendations and was suspect. The challenge for me was to objectively determine if their budgeted HPPD was correct, or not, and if it wasn’t correct what the correct HPPD value should be. In the case of St. Luke’s their budgeted HPPD was 7.04.
I quickly settled on Excel as the platform of choice from which I would develop the RNS HPPD analytics tools. The reason for selecting Excel is that is it used by everyone in healthcare. More importantly, they intuitively understand how to “get to” data that is contained in an Excel worksheet. This would be a critical requirement for the tool set. MediServe clients needed to be able independently verify the results produced by our tools so that they would “buy in” to whatever HPPD our analysis determined actually existed within their data. While the healthcare industry understands the basics of Excel, they don’t have a good grasp of Excel’s more powerful data analytics functions. That meant that whatever tools we created for RNS had to be intuitively easy to use and understand and provide easy access to the raw data for independent validation of RNS results.
Because I’ve had to prototype software concepts throughout my career, I have become skilled at using the Microsoft Office suite of products to create prototype solutions that make tangible, in an easy-to-use, intuitive manner, complex decision support concepts. This exercise was no exception. I am a very advanced user of the Microsoft Office Visual Basic for Applications (VBA) programming language. I began my tool set construction by determining whether or not the client’s staffing grid contained the budgeted HPPD for each census value. This was critically important because if RNS was using the budgeted HPPD value and the staffing grid was using something different then that might explain why RNS was recommending more nurses for St. Luke’s than their staffing grid.
As it turned out, St. Luke’s staffing grid used completely different HPPDs for each of its census entries. This became apparent when I graphed the normal distribution of the HPPD values contained within their staffing grid. RNS, however, used a single HPPD value – St. Luke’s budgeted HPPD – for all its calculations, regardless of census. What I discovered through this analysis was that the mean HPPD for the St. Luke’s staffing grid was 6.5882, not the 7.04 budgeted HPPD that was being used by RNS. Since each census in the St. Luke’s staffing grid contained a different HPPD I needed to understand what the average HPPD was in the data that was used to build the staffing grid during the annual budget exercise. An analysis of the distribution of HPPD by daily census would reveal whether or not St. Luke’s census-based average HPPD came close to matching the average HPPD for their staffing grid.
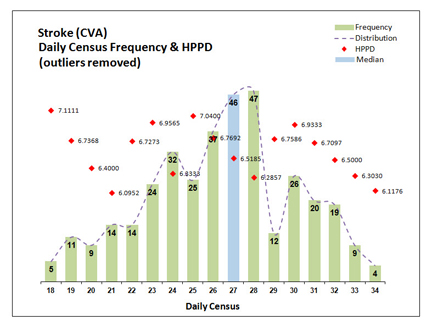
By adding another graph to my Excel tool I was able to determine the average census-based HPPD for the 365 days that were used as the basis for calculating St. Luke’s budgeted HPPD during their annual budget exercise. I used the median census value from these 365 days of data and cross-referenced that value to the HPPD for the matching census in the St. Luke’s staffing grid. The 365-day median census was 27 patients. The HPPD for 27 patients in the St. Luke’s staffing grid was 6.5185. The mean HPPD in the staffing grid was 6.5882. That’s a difference of .0697 HPPD. We split the difference at 6.55 HPPD and re-configured RNS with this new HPPD. To visually confirm these findings I created a third graph which displayed the census for each of the 365 days. Superimposed on the census are the values for the staffing grid mean HPPD, the census-based average HPPD, the actual HPPD for each day’s census (form the staffing grid) the budgeted HPPD. You can view this graph by clicking this link.
We had solved the problem of finding the actual HPPD within client data. However, we still needed to substantiate the distribution of nursing care by type of care (e.g., med/surg, ADL, and rehab nursing care). Like budgeted HPPD, IRFs had never measured the distribution of the three types of IRF nursing care. Nursing leadership was providing MediServe with the distribution of care based upon their best estimate, which was really a “guesstimate.” RNS utilizes care distribution percentages as its primary assumptions when calculating staffing recommendations for each nursing shift. The need for accurate care distribution was critical in order for RNS to produce accurate staffing recommendations.
I proposed that each of our RNS clients conduct an abbreviated nursing time study prior to the installation of RNS to determine the distribution of nursing care. Rank-and-file nurses would fill out a time form where they kept track of how many minutes of med/surg, ADL, and rehab nursing time they delivered to each of their patients during their shift. The results from these time study forms would be tabulated and processed by a new Excel data analytics tool to reveal the percentage distribution of nursing care by med/surg, ADL, and rehab nursing types of care. While the time study concept had its flaws, it at least produced objective data from which nursing leadership could begin to determine care distribution.
The Excel tool that I developed to analyze time study data provides nursing leadership with the ability to conduct an unlimited number of “what-if” analyses simply by highlighting any number of data selection criteria from among six data selection categories – By Nurse, By License, By Day, By Date, By Shift, and By Unit. This flexible and intuitive data criteria selection interface is provided through a Data Selection Control Panel which makes extensive use of VBA and Excel’s ActiveX controls. Every time a new “what-if” analysis is performed the time study analysis tool graphs the distribution of the reported time variance present in the data that have been selected by the user. This is done so that the user can determine whether or not the data follows a normal distribution (a “bell curve”) and be relied upon to characterize the results of the analysis as the “average condition” represented by the selected data.
The final product of every analysis is the nursing care distribution graph. This graph refreshes each time the “Update” button is clicked by the user and displays the distribution of care based upon the data selected. The care distribution graph is used by nursing leadership to view their time study data from different “vantage points” in order to help them determine what they believe represents the most accurate distribution of nursing care for their institution. Once nursing leadership has decided which nursing care distribution metrics reflect thier nursing practices, these metrics are entered into RNS as the primary assumptions used to calculate nurse staffing recommendations.